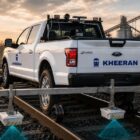
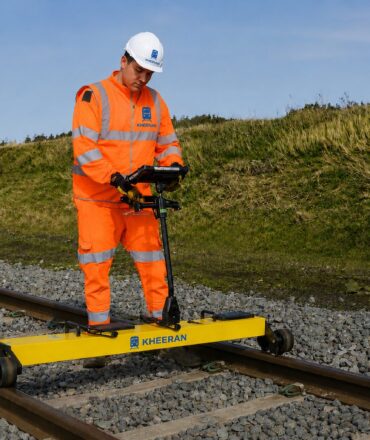
A mobile LiDAR railway survey changes what is possible in corridor inspection. A railway inspector walking 200 km per month covers the surface at walking pace — missing substructure, clearances, and three-dimensional asset geometry. According to RSSB research, technology-assisted inspection dramatically reduces missed defects compared to manual inspection alone. What a mobile LiDAR railway survey captures in a single pass would take teams of inspectors months to collect.
Mobile LiDAR doesn’t replace the inspector. But it does something the inspector cannot: it captures the entire corridor, in three dimensions, at measurement-grade accuracy, in a single survey pass at vehicle speed — producing a permanent, remotely-accessible, dimensionally-accurate record of everything visible within 100 metres of the track.
Here’s what that means for railway asset management, and why the technology is now being adopted at scale by major rail networks in Europe, North America and Australasia.
What a mobile LiDAR railway survey system actually does
The scanner fires laser pulses at millions of points per second in a sweeping pattern. Each pulse returns a reflection, and the time-of-flight of that return — measured in nanoseconds — converts directly to a precise distance. At the speeds a survey vehicle travels, this process creates billions of individual 3D measurement points per hour, each located in space.
The challenge is tying those points to an accurate coordinate system. A GPS receiver tells you where the vehicle is; an inertial measurement unit (IMU) records how the vehicle is oriented — roll, pitch and yaw — at hundreds of times per second. Combining these two systems in a tightly-coupled solution allows the position and orientation of the scanner at the instant each laser pulse was fired to be reconstructed, transforming the raw time-of-flight measurements into precisely georeferenced 3D points in a world coordinate system.
The result is a point cloud: a dataset of billions of points, each with an x, y, and z coordinate, collectively forming a millimetre-resolution 3D model of everything the laser saw — every tree, every signal, every bridge soffit, every rail head — along the entire surveyed corridor.
How the track centreline changes everything
What makes railway LiDAR particularly powerful is the ability to extract the track centreline directly from the scan data — the scanner captures the rail head positions with sufficient accuracy to compute centreline and chainage from the point cloud itself.
Once the centreline is known, every other point in the dataset can be expressed not just as a geographic coordinate but as a chainage, horizontal offset from track centre, and vertical offset from the rail head plane. This transforms the point cloud from a geographic dataset into a railway-native dataset: every signal, every overhead structure, every tree with its distance from the track. These are the measurements that matter for railway engineering — and they come directly from the data without additional field measurement.
The five most valuable applications in practice
1. Clearance analysis. The kinematic envelope of the rolling stock is swept through the point cloud at every chainage point. Any object — structural, vegetation, or equipment — that falls within this envelope is automatically flagged as a clearance concern. For new rolling stock introductions or route upgrades, this replaces weeks of manual gauging surveys along the entire route.
2. Asset inventory. Deep-learning classification models, trained on thousands of examples of railway lineside assets, segment the point cloud automatically — identifying and locating signals, masts, cabinets, level crossing equipment, signs, culverts, platforms and lineside structures. Each extracted asset carries its chainage, offset from track, and dimensional attributes. A complete asset register for a 100-km corridor, generated in days rather than months of manual survey.
3. Vegetation management. Vegetation points are classified and their distances from the track clearance envelope and right-of-way boundary are computed. Trees within a defined risk zone are mapped by chainage, with species height and canopy extent attributes. Risk prioritization — which trees need attention before the next storm — is driven by data rather than the last inspector’s notes.
4. OCS and catenary measurement. For electrified lines, contact wire height, stagger and catenary geometry are extracted at every track position without disrupting train operations. The data integrates with OCS management systems and provides a baseline for ongoing compliance monitoring.
5. Bridge, tunnel and structure assessment. As-built 3D models of bridges, tunnels, retaining walls and platforms are built from the point cloud. Dimensional checks against design drawings, detection of structural movement between repeat surveys, and planning of maintenance interventions are all conducted from the data remotely — without additional possession time or inspection equipment.
The role of AI in making it practical
A single survey day generates 100 GB or more of raw point cloud data. Manual analysis of that volume is not practical at scale. What makes large-scale LiDAR asset management viable today — rather than theoretically interesting — is the maturity of AI-assisted point cloud processing.
Deep-learning models trained specifically on railway environments can now segment railway point clouds with high accuracy, automatically classifying ground, ballast, track, lineside equipment, structures and vegetation. Asset extraction algorithms detect, locate and measure individual objects — a signal head, a mast, a culvert opening — with human-level accuracy and at computational speed that manual analysis cannot approach.
The engineer’s role shifts from manual digitization to quality assurance and engineering interpretation — reviewing AI outputs, resolving ambiguous cases, and applying judgment to the prioritized list of identified conditions. The AI handles the scale; the engineer handles the meaning.
Building a corridor digital twin with repeat surveys
A single LiDAR survey produces a point-in-time record of your corridor. Repeat surveys at regular intervals — annually, or semi-annually for critical corridors — allow automated change detection: comparing the new point cloud to the previous survey to identify what has moved, grown, degraded or appeared. A new structure under a bridge. A tree that has grown 0.3 m closer to the clearance envelope. A retaining wall face that has shifted.
This is the operational definition of a corridor digital twin: a live model that updates with each survey, giving network operators visibility into how their infrastructure is evolving over time — without continuous on-track presence.
The LiDAR digital twin doesn’t require continuous monitoring to be useful — it requires frequent enough surveys that change is detected before it becomes a risk. For most assets, that means an annual survey is sufficient; for higher-risk elements, semi-annual.
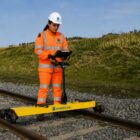
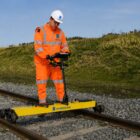
Combining LiDAR with GPR and geometry in one campaign
The highest value comes from integrating LiDAR with the other survey technologies in a single mobilization. GPR reveals what lies beneath the ballast: fouling, water, thin clean-ballast layers. Geometry measurement tells you how the track is riding: gauge, alignment, twist, cross-level exceptions. LiDAR shows you everything above and beside the track: assets, clearances, vegetation, structures.
All three datasets are referenced to the same chainage. A section with poor geometry, fouled ballast in the GPR data, and an encroaching tree in the LiDAR data is a different maintenance priority than a section with good substructure showing only a minor geometry exception. The integrated picture changes the maintenance decision.
One hi-rail mobilization. Three technologies. A complete picture of your corridor — above and below the ballast line. → Plan Your LiDAR Survey | → See All Three Services